Drive toward your vision with data
At Slalom, experience meets empathy. We’ll help you make the most of the Tableau platform in order to transform how your teams think about, interact with, and learn from data—so that the people you serve get what they need, faster. Our Accelerators provide a template that you can use to get started with your own data.
While a great starting point, an Accelerator isn’t a one-size-fits-all approach. We start by listening to understand your unique challenges and pressures, and tailor the accelerator to your organization’s goals. Keep scrolling to read about our Tableau industry solutions and how we are making a difference with data. Fill out the form to get connected with someone from our team.
Disclaimer: Slalom is a partner of Tableau*.
Slalom was recognized as the Services Partner of the year for the Americas. Tableau also awarded us as the GLOBAL Services Partner of the year!

Let's connect
Check out the solutions
GridPulse

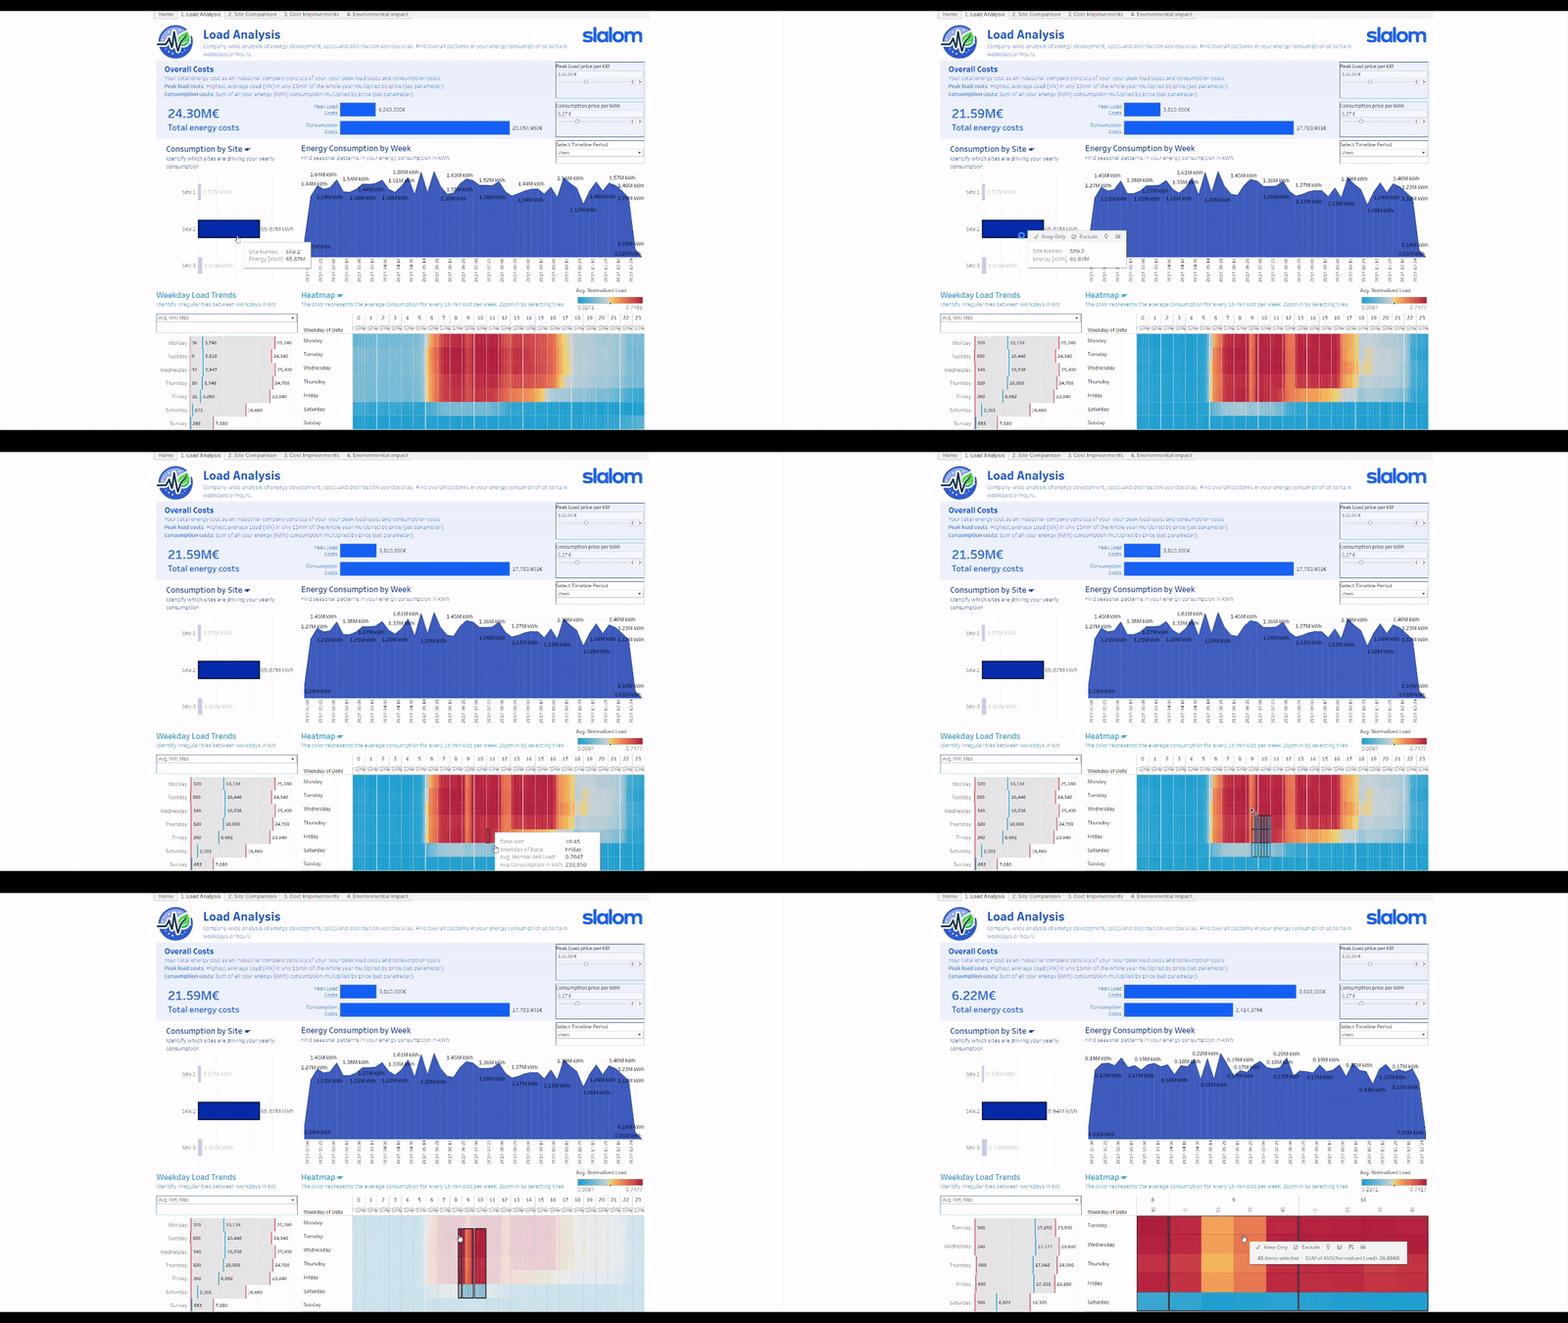
GridPulse empowers businesses by providing insights into energy usage, costs, and environmental impact. By analyzing consumption patterns and identifying cost-saving opportunities, it helps businesses optimize energy usage, reduce costs, and lower CO2 emissions. GridPulse enables informed decision-making, promotes sustainability, and helps businesses track progress towards their energy efficiency goals.
ESG Impact Tracking
This accelerator provides an overview of an organization's environmental and social impacts. It shows historical data for energy consumption, emission break-downs, and waste. It includes forecasts which show future landfill reductions and energy-mix changes required to meet strategic goals. Explore the demographic representation and employee engagement within your organization and keep track of diversity incidents and outcomes.
Sustainable Supply Chain

This accelerator provides an overview of each facility within the supply chain and how they are performing against their ESG goals. This information can be summarized across the entire supply chain, or filtered down by a specific product, facilities within the company's 'top spend' or by country.
Mitigate Credit Risk and Find Opportunity
Industry: Financial Services

COVID-19 has resulted in a rapidly changing credit market. Although policies have been adjusted to accommodate borrowers economically impacted, existing risk models lack the flexibility or granularity to adapt to the crisis, which prevents teams from identifying crucial trends and insights.
Our expertise allows us to build a suite of real-time reports and enable risk management on the fly, providing your firm's ability to shift strategy and anticipate the economic impact of the pandemic as it unfolds.
Shining a Light on Recovery and Reopening
Industry: Public Sector

Many cities have started collective data to drive the difficult challenge of determining the safest path to recovery from the COVID-19 pandemic. Numerous factors contribute to a safe recovery, and understanding what metrics are important is crucial for a successful reopening.
Our Recovery and Reopening Solution, which we've delivered to the third-largest city in North America, provides easy to navigate and richly informative visualizations of key data and health and wellness statistics.
Read the case study | Check out the viz | See it in action
Evolving a Vision Towards Greater Gender Equity
Industry: Public Sector

According to the World Economic Forum, it will take more than 108 years to close the global gender gap. Data acts as a critical factor for measuring change, and helps fuel a vision toward more significant gender equity.
Our Gender Equity Toolkit Solution, which successfully rolled out to the U.S.'s second-largest city, outlines the data-driven methodology, tactics, and tools necessary to build a framework for Gender Equity. We help you align with the evolving Gender Equity vision and establish metrics and methods for measuring progress through interactive visualizations.
Read the case study | Check out the viz | Download the toolkit
Enabling Police Transparency through Data
Industry: Public Sector

Policing policies and behaviors are making headlines. While policing agencies collect and store relevant data sets that could help drive insights and identify trends, analytics capabilities are usually not available.
Our Police Department Transparency Solutions consist of deep-dive discovery, dashboard design, and implementation. These solutions help law enforcement agencies visualize answers to questions ranging from implicit bias and racial disparity to evaluating strategy, policy, and individual performance.
Read the blog | Check out the vizzes: San Francisco | Chandler | Phoenix
Questions?
For questions about this content or general support, please visit our Tableau page and click “Let’s Talk” to request a call.
*Slalom is not an authorized reseller or license issuer for the Tableau Platform. Please work with your Tableau representative to license the Tableau Platform.